Overview
PasaLaredo is a mobile-first Progressive Web App that provides real-time wait times for U.S. and Mexico border crossings in Laredo, Texas. It pulls live data from U.S. Customs and Border Protection (CBP) and transforms it into a fast, glanceable interface designed for people who need to make time-sensitive decisions before heading to the border.
The project was designed and built end-to-end in one week, with a focus on usability, performance, and reliability under real-world conditions.
Context
Border crossings in Laredo are used daily by commuters, commercial drivers, and pedestrians. Wait times can vary significantly depending on the bridge, lane type, and time of day.
While CBP provides this data publicly, existing tools are often:
-
difficult to navigate on mobile
-
slow to interpret
-
not designed for quick, real-world decision-making
This creates friction for users who often need to check conditions quickly while on the go.
The Problem
The core issue wasn’t access to data; it was usability.
Existing solutions made it difficult to:
-
quickly compare multiple crossings
-
understand delays at a glance
-
make fast decisions in time-sensitive situations
This is especially critical for commercial drivers, where delays directly translate to lost time and money.
Goals and Constraints
Goals
-
Make border wait time data easy to scan and compare
-
Optimize for mobile, on-the-go usage
-
Support frequent, repeat checks throughout the day
-
Provide both real-time status and historical context
Constraints
-
Reliance on external CBP API
-
Need to avoid overloading the source data provider
-
No user accounts (anonymous usage only)
-
Must work in low or inconsistent connectivity environments
Our Role
We designed and developed the entire application end-to-end, including:
-
Product definition and feature scoping
-
UX and interface design
-
Frontend development (Next.js, Tailwind)
-
Backend API routes and data ingestion
-
Database design (PostgreSQL + Prisma)
-
PWA architecture and offline support
The project went from concept to production in approximately one week.
Approach
We focused on two primary challenges:
1. Making data usable
Raw CBP data is structured but not user-friendly. We built a system to:
-
normalize and clean incoming data
-
map it into consistent records across crossings, modes, and lane types
-
surface only the most relevant information for quick decisions
2. Designing for real-world usage
Users are often:
-
on mobile devices
-
in transit
-
dealing with unreliable connectivity
To address this, we designed for:
-
fast load times
-
minimal interaction cost
-
offline fallback
Solution
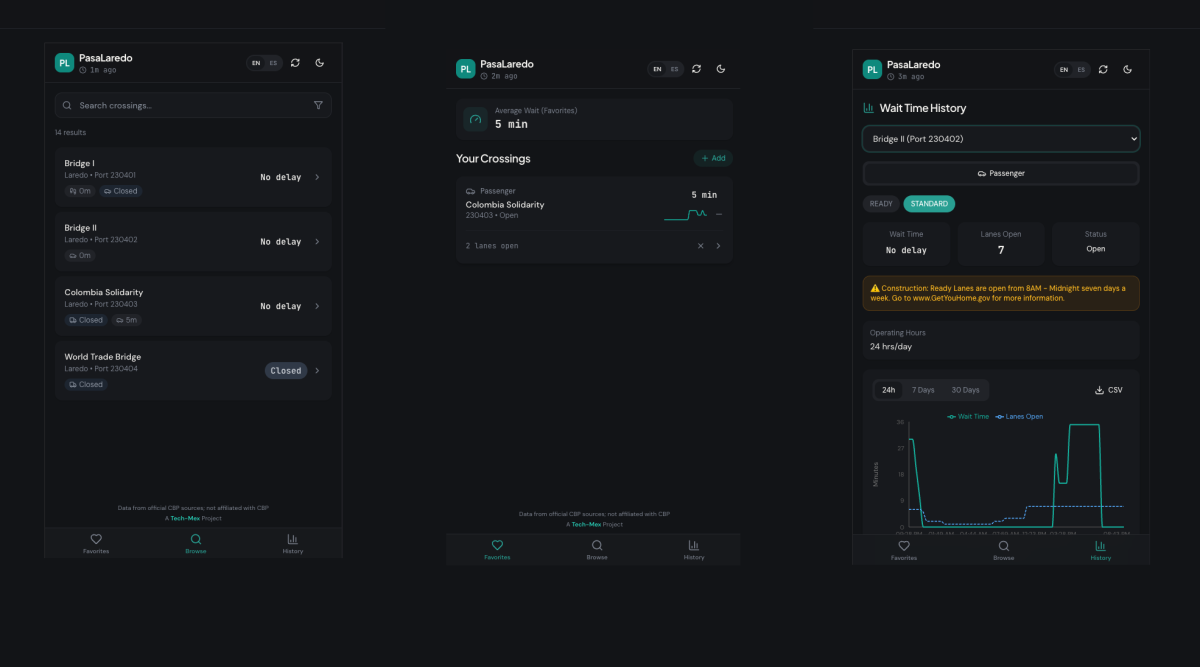
PasaLaredo combines real-time data with a UI optimized for quick interpretation.
Live Wait Times
-
Real-time delay data across all Laredo crossings
-
Multiple modes (passenger, commercial, pedestrian)
-
Lane-specific details (FAST, READY, SENTRI)
Favorites Dashboard
-
Save frequently used crossings
-
Color-coded delay indicators for instant scanning
-
Trend signals to show whether conditions are improving or worsening
Historical Trends
-
24-hour, 7-day, and 30-day views
-
Combined wait time and lane availability data
-
CSV export for deeper analysis
Search and Filtering
-
Quickly find crossings by name or type
-
Filter by mode and lane type
Offline Support (PWA)
-
Cached data available without connectivity
-
Clear freshness indicators to communicate data age
Bilingual Experience
-
Full English and Spanish support
-
Language preference persisted locally
Key Decisions and Tradeoffs
Polling vs real-time streaming
We chose scheduled polling (hourly ingestion + 5-minute client refresh) instead of real-time streaming.
-
Why: reduces load on CBP systems and simplifies infrastructure
-
Tradeoff: slightly less real-time accuracy in exchange for reliability and simplicity
PWA instead of native app
-
Why: faster to ship, no app store friction, works across devices
-
Tradeoff: limited access to some native capabilities
Network-first caching strategy
-
Always attempt fresh data first
-
Fall back to cached data when offline
-
Tradeoff: occasional stale data vs consistent usability
Data cleaning layer
Significant effort went into normalizing inconsistent API responses.
-
Why: ensures reliable UI and prevents misleading information
-
Tradeoff: added backend complexity
Outcome
The product has just launched, so quantitative metrics are not yet available.
Early signals:
-
Positive feedback from Laredo residents
-
Initial validation that the simplified, mobile-first interface improves usability over existing tools
The app is live and positioned for real-world usage and iteration.
What We Learned
Usability matters more than data availability The biggest improvement came from presentation, not new data.
Speed of execution can be a competitive advantage Shipping in one week helped validate the idea quickly.
Designing for constraints leads to better decisions API limits and connectivity issues directly shaped the architecture.
Data cleaning is often the hardest part of “data products” Making data reliable and consistent required more effort than displaying it.
Next Steps
-
Collect usage data and identify high-frequency user patterns
-
Refine UI based on real user behavior
-
Explore notifications or alerts for major delay changes
-
Improve historical insights for planning ahead
Visit PasaLaredo to get up-to-date bridge info.